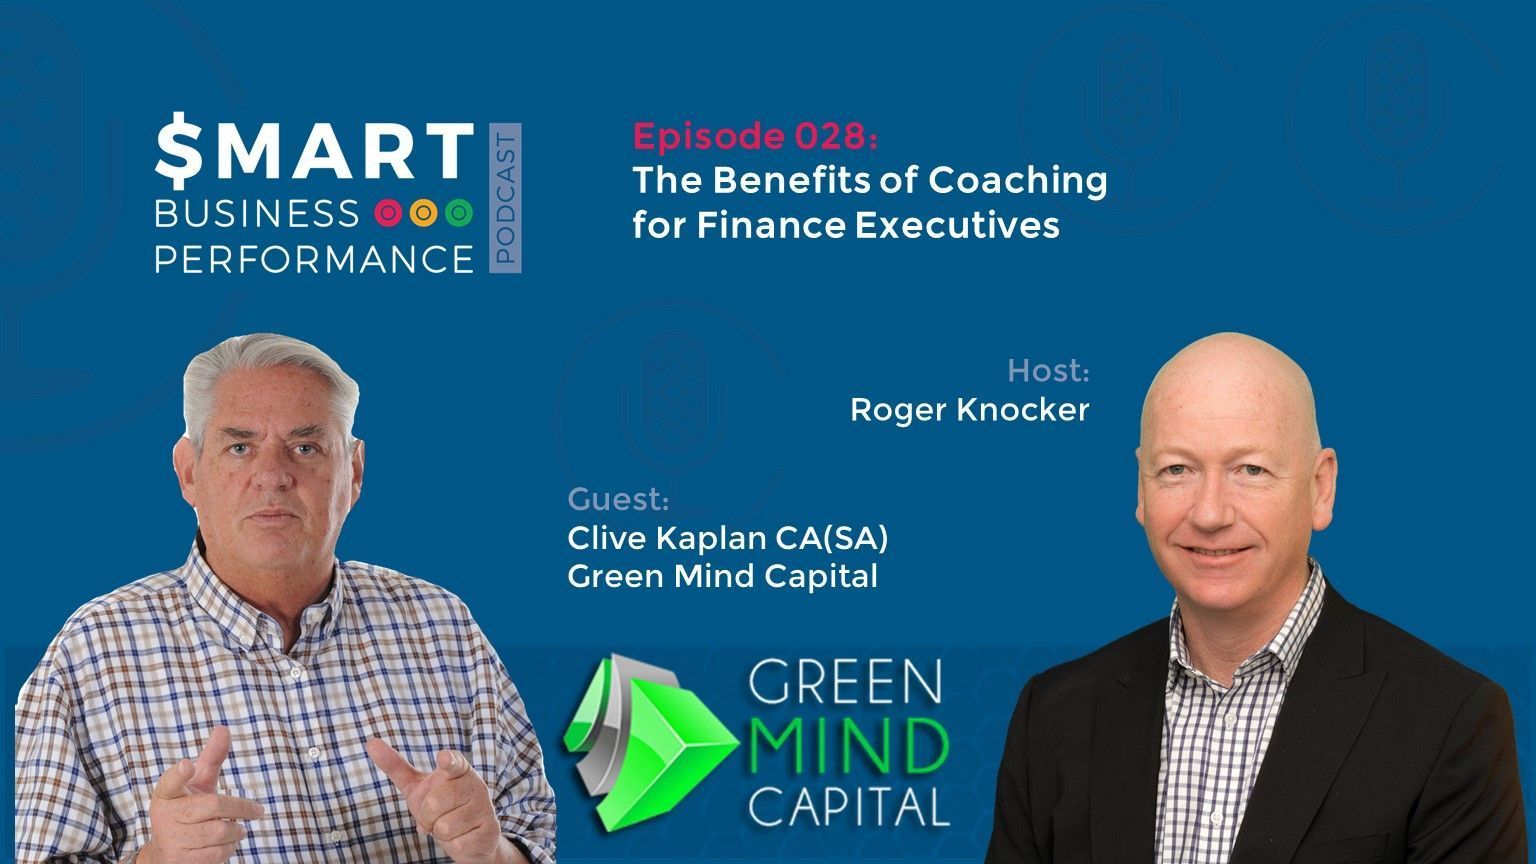
SBP028: The Benefits of Coaching for Finance Executives
Roger Knocker • January 29, 2024
SBP028: The Benefits of Coaching for Finance Executives
Do you know? Coaching can be a key driver of performance.
Want to know more about coaching and how can it enhance your business performance?
Our guest today, will break down everything you need to know about coaching.
In this of the Smart Business Performance Podcast, Roger welcomes Clive Kaplan, the CEO of GREEN MIND CAPITAL (Pty) Ltd. The company focuses on assisting executives, especially emerging young CA’s, in maximizing their potential and fast-tracking their careers.
Clive is a South African Charted Accountant CA(SA) with over 20 years’ experience as an executive director in both listed and unlisted companies.
He brings some interesting perspectives to the field of management. Having been involved at Director/Board level, he offers a wealth of wisdom on both the people and business front.
[01:04] Clive was, from the beginning, preparing himself to become an executive coach. He explains that Passion is important as it fuels your drive towards success.
[05:14] Clive focuses mainly on coaching the CA market. He has more of a fifth-dimensional view of the clients and helps them move from the manager space into the executive space. He also elaborates on the present scenario of CAs in the business world.
[09:15] The CFO is responsible for everything regarding finance in the business. Clive markets a 6-Session package which covers the important things that one needs to be aware of in stepping into the executive space.
[16:47] It’s all about the candidates and not about the company.
[22:22] Clive explains that not every executive needs a coach. If you do things differently, you can create different results.
[25:35] Clive thinks that COVID has turned the world into a digital space. It has created a lot of opportunities for the people.
[31:14] Clive elaborates on the key technical skills that young financial professionals need to develop. He / She needs to digitize the office of finance and then go on to help the colleagues.
Special Reminder:
About Our Sponsor:
KPI Management Solutions helps organizations to implement their BUSINESS STRATEGY and track the PROFITABILITY impact through to the Income Statement.
Check us out at www.kpims.co.za.
Download the KPI Spreadsheet for FREE for a limited time only.
Connect with Clive: At GREEN MIND CAPITAL website On LinkedIn Or email him at clive@greenmindcapital.co.za WhatsApp him at +27 72 280 6878
If you enjoyed this episode of the Smart Business Performance Podcast, then make sure to subscribe to our podcast.
Want to know more about coaching and how can it enhance your business performance?
Our guest today, will break down everything you need to know about coaching.
In this of the Smart Business Performance Podcast, Roger welcomes Clive Kaplan, the CEO of GREEN MIND CAPITAL (Pty) Ltd. The company focuses on assisting executives, especially emerging young CA’s, in maximizing their potential and fast-tracking their careers.
Clive is a South African Charted Accountant CA(SA) with over 20 years’ experience as an executive director in both listed and unlisted companies.
He brings some interesting perspectives to the field of management. Having been involved at Director/Board level, he offers a wealth of wisdom on both the people and business front.
Conversation Highlights:
[01:04] Clive was, from the beginning, preparing himself to become an executive coach. He explains that Passion is important as it fuels your drive towards success.
[05:14] Clive focuses mainly on coaching the CA market. He has more of a fifth-dimensional view of the clients and helps them move from the manager space into the executive space. He also elaborates on the present scenario of CAs in the business world.
[09:15] The CFO is responsible for everything regarding finance in the business. Clive markets a 6-Session package which covers the important things that one needs to be aware of in stepping into the executive space.
[16:47] It’s all about the candidates and not about the company.
[22:22] Clive explains that not every executive needs a coach. If you do things differently, you can create different results.
[25:35] Clive thinks that COVID has turned the world into a digital space. It has created a lot of opportunities for the people.
[31:14] Clive elaborates on the key technical skills that young financial professionals need to develop. He / She needs to digitize the office of finance and then go on to help the colleagues.
Special Reminder:
- Still confused?
- Don’t know your passion?
- Make sure to check out Clive’s Course to help you find your passion.
About Our Sponsor:
KPI Management Solutions helps organizations to implement their BUSINESS STRATEGY and track the PROFITABILITY impact through to the Income Statement.
Check us out at www.kpims.co.za.
Download the KPI Spreadsheet for FREE for a limited time only.
Connect with Clive: At GREEN MIND CAPITAL website On LinkedIn Or email him at clive@greenmindcapital.co.za WhatsApp him at +27 72 280 6878
If you enjoyed this episode of the Smart Business Performance Podcast, then make sure to subscribe to our podcast.

Before automating finance processes, map and understand workflows to avoid scaling inefficiencies and ensure meaningful results.

Activity-based costing reveals hidden costs below gross profit, helping finance teams understand true profitability and improve decision-making.