SBP029: How to start a business from scratch, & scaling it before exiting
Roger Knocker • January 30, 2024
SBP029: How to start a business from scratch, & scaling it before exiting
In this of the Smart Business Performance Podcast, Roger welcomes Bryan Clayton, and discusses the entrepreneurial ventures of Bryan. He definitely will revamp your thoughts about Entrepreneurship by the end of this episode!
Bryan is the CEO and co-founder of GreenPal an online marketplace that connects homeowners with Local lawn care professionals. GreenPal has been called the “Uber for lawn care” by Entrepreneur magazine and has over 200,000 active users completing thousands of transactions per day.
Before starting GreenPal Bryan Clayton founded Peachtree Inc. one of the largest landscaping companies in the state of Tennessee growing it to over $10 million a year in annual revenue before it was acquired by Lusa holdings in 2013.
Bryan’s interest and expertise are related to entrepreneurialism, small business growth, marketing and bootstrapping businesses from zero revenue to profitability and exit.
Tune in now and make sure to take away the notes with you!
[01:09] Bryan has been in business for more than 20 years. His father, one day, asked him to cut the neighbours grass. It was his first business, that he grew to one of the largest landscaping company, worth more than $10 million.
[02:48] He wanted to sell the company so that it could become a part of something bigger and his team members could have better opportunities. Lusa holdings finally acquired the company in 2013.
[04:24] It was as if the author of the book was shedding light on Bryan. If you have too many products and services, you need to consolidate before you sell your business. Bryan then emphasized the need to be the best at one thing.
[08:29] Bryan, after selling the Peachtree Inc., realised that business gives him the reason to level up and grow. So, in order to fill the void, he laid the foundations of GreenPal. GreenPal is like the “Uber for lawn care.” He believes that revenues are the best form of financing.
[14:00] Bryan explains the importance of Profit at different stages of business. You first need is to get revenue. He further elaborates on the importance of customer feedback and shares some of the memorable feedbacks he received at GreenPal.
[21:19] Leveraging technology is a great opportunity for you to take your business to the next level and now is the time to implement it.
[24:57] Hire an expert for 4-5 hours a week than hire a newbie for 50 hours a week.
[27:28] Bryan thinks that if you look at your business as an infinite game, then you can help yourself get through the hard times. Failure is not an option. He also stresses the importance of Culture.
Make sure to get your copy of
Download the GreenPal app Now!
On App Store On Google Play Store
About Our Sponsor:
KPI Management Solutions helps organisations to meet their Stretch Goals using KPIs, OKRs, AI-enabled Technology and Training
Download the KPI Spreadsheet for FREE for a limited time only.
Connect with Bryan:
Website
If you enjoyed this episode of the Smart Business Performance Podcast, then make sure to subscribe to our podcast.
Bryan is the CEO and co-founder of GreenPal an online marketplace that connects homeowners with Local lawn care professionals. GreenPal has been called the “Uber for lawn care” by Entrepreneur magazine and has over 200,000 active users completing thousands of transactions per day.
Before starting GreenPal Bryan Clayton founded Peachtree Inc. one of the largest landscaping companies in the state of Tennessee growing it to over $10 million a year in annual revenue before it was acquired by Lusa holdings in 2013.
Bryan’s interest and expertise are related to entrepreneurialism, small business growth, marketing and bootstrapping businesses from zero revenue to profitability and exit.
Tune in now and make sure to take away the notes with you!
Conversation Highlights:
[01:09] Bryan has been in business for more than 20 years. His father, one day, asked him to cut the neighbours grass. It was his first business, that he grew to one of the largest landscaping company, worth more than $10 million.
[02:48] He wanted to sell the company so that it could become a part of something bigger and his team members could have better opportunities. Lusa holdings finally acquired the company in 2013.
[04:24] It was as if the author of the book was shedding light on Bryan. If you have too many products and services, you need to consolidate before you sell your business. Bryan then emphasized the need to be the best at one thing.
[08:29] Bryan, after selling the Peachtree Inc., realised that business gives him the reason to level up and grow. So, in order to fill the void, he laid the foundations of GreenPal. GreenPal is like the “Uber for lawn care.” He believes that revenues are the best form of financing.
[14:00] Bryan explains the importance of Profit at different stages of business. You first need is to get revenue. He further elaborates on the importance of customer feedback and shares some of the memorable feedbacks he received at GreenPal.
[21:19] Leveraging technology is a great opportunity for you to take your business to the next level and now is the time to implement it.
[24:57] Hire an expert for 4-5 hours a week than hire a newbie for 50 hours a week.
[27:28] Bryan thinks that if you look at your business as an infinite game, then you can help yourself get through the hard times. Failure is not an option. He also stresses the importance of Culture.
Special Reminder:
Make sure to get your copy of
- Built to sell: Creating a Business That Can Thrive Without You
- Fix this next: Make the Vital Change That Will Level Up Your Business
- The Infinite Game
Download the GreenPal app Now!
On App Store On Google Play Store
About Our Sponsor:
KPI Management Solutions helps organisations to meet their Stretch Goals using KPIs, OKRs, AI-enabled Technology and Training
Download the KPI Spreadsheet for FREE for a limited time only.
Connect with Bryan:
Website
If you enjoyed this episode of the Smart Business Performance Podcast, then make sure to subscribe to our podcast.
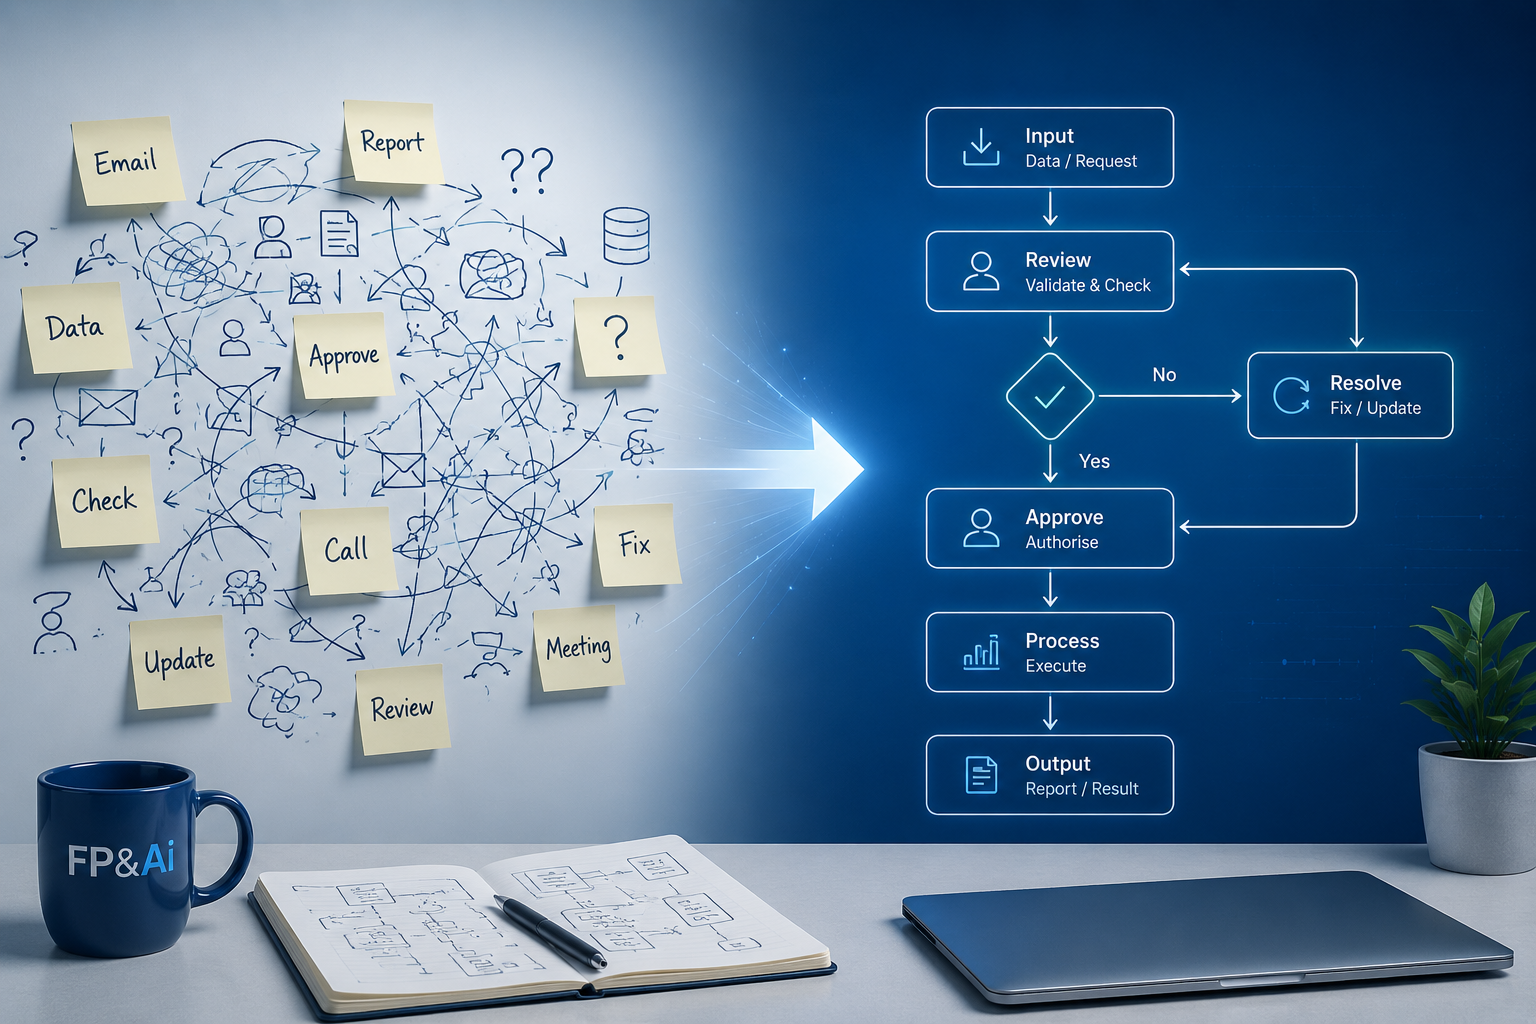
Before automating finance processes, map and understand workflows to avoid scaling inefficiencies and ensure meaningful results.

Activity-based costing reveals hidden costs below gross profit, helping finance teams understand true profitability and improve decision-making.