The Worm and The Waterfall
Roger Knocker • October 7, 2025
The Worm and the Waterfall: How Johan Turned Finance into a Story Everyone Understood
Finance updates are supposed to guide decisions.
So why do most of them feel like punishment?
Black-and-white statements.
Tables of variances.
Forty pages of data that leave everyone bored and none the wiser.
Then there’s Johan.
A Volunteer Who Changed the Game
Johan wasn’t a corporate CFO.
He was a volunteer deacon, leading the finance committee at his church.
No big team. No flashy tools. Just a conviction that numbers should make sense and inspire action.
When the church needed to raise funds to hit its objectives, Johan knew the standard “actual vs target”
report wouldn’t cut it.
So, he built two charts that changed everything:
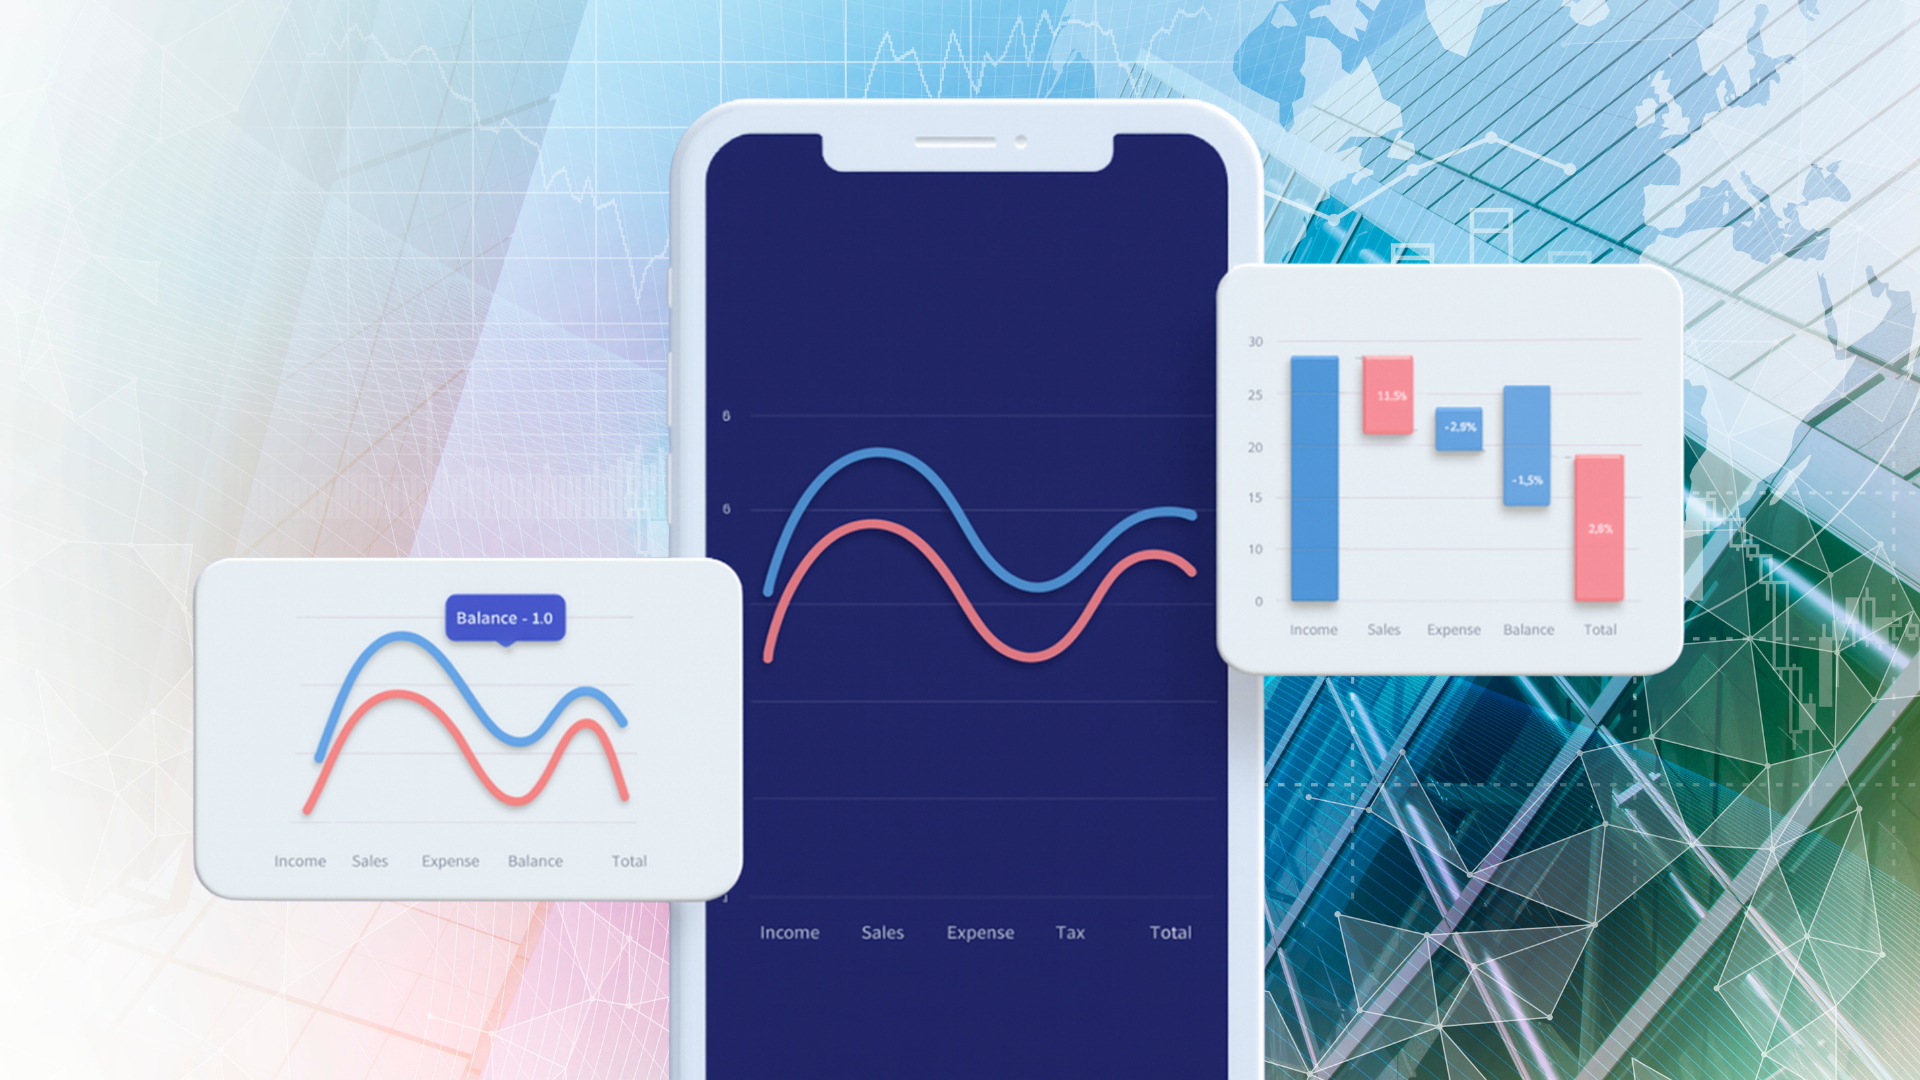
1. The Worm Chart
The worm chart tracked donations against the budget the church had calculated to achieve its goals.
Whenever donations dipped, Johan simply put the worm chart on the screen.
No guilt trips. No lengthy explanations.
And bam! Donations came in.
People didn’t need persuasion.
They just needed to see the gap and understand the story behind it.
2. The Waterfall Chart
AGMs used to be tedious marathons of financial statements,
page after page of black-and-white tables no one wanted to read.
Johan cut through that noise.
His waterfall chart, explained in just a few minutes, was 90% of what people needed to
understand the finances.
It showed how actual finances tracked to budget,
positive variances, negative variances, the size of every gap,
all on one clean and simple visual chart.
Suddenly, finance wasn’t boring. It was clear. It mattered.
The Real Lesson
Here’s the kicker: Johan used the same Excel everyone else had.
It wasn’t about the tool.
It was clarity and creative thinking
that won the day.
Finance doesn’t need more complex reporting.
It needs leaders who can tell the story behind the numbers.
The Challenge to Finance Teams
Would your reports spark action?
Would they make the story so obvious that people could not help but respond?
If not, maybe it’s time to simplify.
Find your worm chart.
Build your waterfall.
Make the numbers impossible to ignore.
This article is inspired by my conversation with Andrew Brown on the FP&AI Podcast –
Episode 1: Finance as a True Business Partner – Beyond the Numbers.

Before automating finance processes, map and understand workflows to avoid scaling inefficiencies and ensure meaningful results.

Activity-based costing reveals hidden costs below gross profit, helping finance teams understand true profitability and improve decision-making.