The Five-Minute Lesson That Changed How I Teach Data Analysis
How a CFO's approach to management accounts inspired my 10 tips for getting insights from data.

I remember sitting in a CFO's office many years ago while working on a business improvement project.
There was a knock on the door.
One of the general managers had been called in to explain why his HR costs were so high.
He started explaining. There was a bit of this, a bit of that. Costs had gone up because of one thing, but then there was another explanation. He was jumping between numbers and contradicting himself.
Eventually, the CFO stopped him.
He said:
"For the next five minutes, I'm going to show you how I analyse your management accounts. I'm going to tell you what I find important, and then next month you'll know what I look for, and you can copy me."
And then he did exactly that.
Five minutes that stayed with me
The CFO started by explaining what he was trying to achieve.
He was looking at costs, and his objective was to contain them.
Then he went through the numbers.
First, he looked at actual costs against budget, for the month and year to date. Where were the biggest variances?
He compared the costs to the previous year. Had they increased or decreased? By how much, and by what percentage?
He looked at the trends. Were things getting better or worse?
He identified the biggest expenses because those were the areas he wanted to focus on.
And he looked at the mix. For example, what was staff welfare as a percentage of total HR costs, and how did that compare with what had been budgeted?
There was nothing particularly complicated about any of it.
But what struck me was how structured his thinking was.
He knew exactly what he was looking for, and he could explain it in a way that somebody else could follow.
And that last part mattered.
He wasn't just analysing the numbers. He was showing someone else how to do it.
I realised I couldn't have explained it that clearly
At that stage, I'd already spent years working in data analytics and business intelligence.
I'd built data warehouses, developed thousands of reports and worked with metrics across different businesses.
I knew the tools. I knew how to analyse data.
But sitting there listening to that CFO, I realised something.
If somebody had asked me to explain how to analyse a set of management accounts in five minutes, I probably would have bumbled around.
Not because I didn't know how to do the analysis.
I just didn't have a simple, repeatable framework for explaining it.
I knew how to analyse data. What I didn't have was a simple way to teach someone else how to do it.
So, I developed a checklist
That thought played on me for a long time.
Eventually, I started putting together a set of principles that anybody could use when analysing data.
Looking back, the CFO had covered four or five of them in those five minutes.
Over the years, the list grew to twelve or thirteen concepts. We consolidated some of them and eventually settled on ten because we wanted something practical and easy to understand.
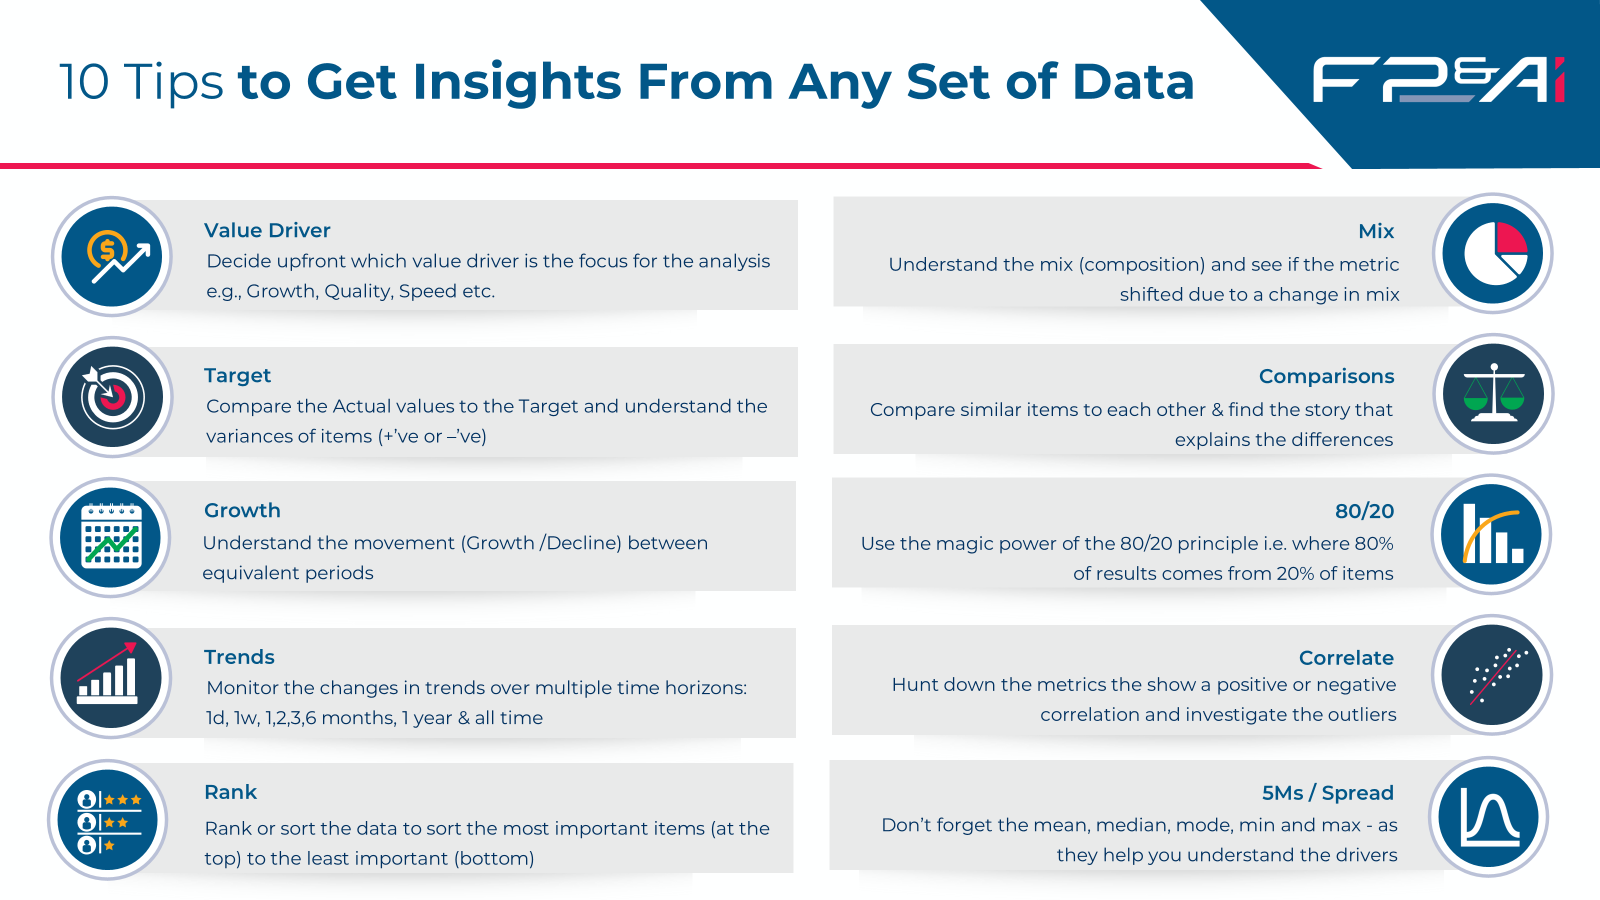
I call them my 10 Tips to Get Insights from Any Set of Data.
They cover:
- Value Driver: Understand what you're trying to achieve and who the analysis is for.
- Target: Compare actual performance against expectations.
- Growth: Look at movements between comparable periods.
- Trends: Understand how performance is changing over time.
- Rank: Put the most important information first.
- Mix: Examine how the composition of the numbers has changed.
- Comparisons: Compare similar items to understand performance differences.
- 80/20: Identify the relatively small number of items driving most of the results.
- Correlation: Look for relationships between measures and investigate outliers.
- The Five Ms: Use the mean, median, mode, minimum and maximum to better understand your data.
None of these is rocket science.
And that's really the point.
The value is in having a method you can work through, rather than trying to decide where to start each time someone puts a set of numbers in front of you.
Know what you're looking for
The first of my ten tips is to identify the value driver.
Before analysing anything, ask yourself who the analysis is for and what they're trying to achieve.
Are they looking for growth? Are they trying to control costs? Identify sales opportunities? Manage risk?
That was the first thing the CFO established when he explained his approach to the management accounts.
He was looking at costs because his objective was cost containment.
Once you know what you're looking for, you can work through the different ways of analysing the numbers.
You can compare actual performance against targets, look at growth and trends, rank the most significant items or investigate changes in mix.
In the webinar, I demonstrate how different visualisations can help you do that.
But the starting point is knowing what you want to understand.
The visualisation should support the analysis, not become the objective.
Putting the 10 tips into practice
In Episode 17 of the FP&Ai Podcast, Mastering Data Visualisation for Real Insights, I take viewers through these ten principles using practical Power BI demonstrations.
I show different ways to examine targets, growth, trends, rankings, mix, comparisons and statistical measures, and how different charts can help reveal what's happening in the data.
The techniques aren't limited to Power BI. You can apply the same thinking in Excel, Tableau, Qlik or even a simple management report.
Over the coming days, we'll also be sharing a series of short videos showing some of these ideas in action.
We'll look at things like why 80% of sales might come from just 3% of countries, why sales growth of 85% can tell a different story when volume has grown by 188%, and why sorting a report alphabetically might mean the most important information isn't where you'd expect to find it.
Each example demonstrates a different way of looking at the numbers.
And it all goes back to that conversation in the CFO's office.
He had a method. He could explain it. And someone else could copy it.
That's what I've tried to capture in these ten tips.
Because finding insights shouldn't depend on someone already knowing where to look. A good method gives them somewhere to start.
Watch me demonstrate the 10 tips with practical Power BI examples.
Follow FP&Ai on LinkedIn for our series of short videos exploring practical ways to find insights in your data.